
- Commissioner’s statement on Ventura, Marte
- Ronnie O’Sullivan: Masters champion ‘felt so vulnerable’ in final
- Arron Fletcher Wins 2017 WSOP International Circuit Marrakech Main Event ($140,224)
- Smith challenges Warner to go big in India
- Moncada No. 1 on MLB Pipeline’s Top 10 2B Prospects list
- Braves land 2 on MLB Pipeline’s Top 10 2B Prospects list
- Kingery makes MLB Pipeline’s Top 10 2B Prospects list
- New Zealand wrap up 2-0 after Bangladesh implosion
- Mathews, Pradeep, Gunathilaka to return to Sri Lanka
- Elliott hopes for rain for Poli
Statcast outfield data may shed light on Harper, McCutchen
- Updated: September 26, 2016
One of the more interesting things about Statcast™ data is that we can use it to identify the starting positions of outfielders. After all, you can’t know how far a fielder ran without knowing where they started, and that’s how we plan to eventually lead to some revealing new defensive metrics. For now, we can use the data on hand to look at what defensive positioning might tell us about some of what we see in the outfield. Here are four fun facts:
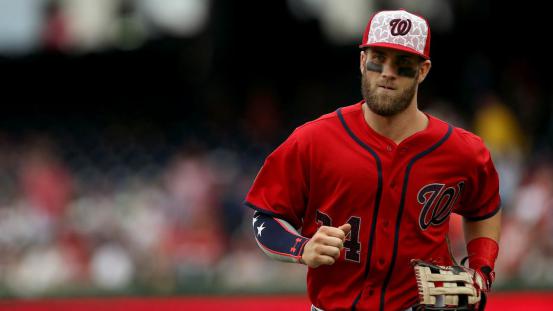
1. Might Bryce Harper’s defense tell us something about his offense?
Despite a third National League East title in five years for Washington, there’s still no clarity on what’s been ailing Harper for most of the season, as an outstanding April (.286/.406/.714, nine home runs) was followed by five frustrating months (.237/.369/.395, 15 home runs). Multiple reports have surfaced suggesting Harper is dealing with a neck or right shoulder injury, and multiple times, the Nationals have denied it.
We can’t know the truth, and so we won’t speculate on what the real issue is, if any. But what is interesting to look at is what the data says, particularly in light of reports that Harper was playing excessively shallow earlier this month in Atlanta.
Harper monthly positioning, feet from home April — 290 May — 290 June — 283 July — 284 Aug — 286 Sept — 279MLB right-field average: 294 feet
The summer months were clearly shorter than the first two months, and September stands out as being shallower still. On a Gordon Beckham double on Sept. 16 in the Atlanta series, Harper was just 265 feet away from home, which is how a ball that was projected only at 320 feet could land so far over his head.
What about arm strength? Last year, Harper’s arm strength on “competitive throws” was 95.5 mph, one of the 10 best outfield marks in the game. This year, that’s 93.2 mph, and you can see what’s happened over the past two months:
Harper arm strength on “competitive throws” April — 92.3 mph May — 93.8 mph June — 94.9 mph July — 94.1 mph Aug — 90.2 mph Sept — 89.8 mphMLB right-field average: 88.9 mph
Now, Harper also has a sore thumb to worry about, injured on a slide in Pittsburgh on Sunday, which makes the situation even murkier. It might be the last thing a Nats team already worrying about injuries to Stephen Strasburg and Daniel Murphy needs. A shallower position and less on his throws probably doesn’t reassure fans about his right shoulder, either.
2. Andrew McCutchen might be a better outfielder than the metrics credit him for.
Per Defensive Runs Saved, McCutchen’s negative-25 runs isn’t just the worst mark of any fielder this year, it’s the seventh worst of any fielder going back to 2008. Now to some extent, a defensive decline makes perfect sense, because 2016 was McCutchen’s least-productive year on offense, too. His slugging percentage has dropped from .542 to .488 to .439 over the past three …